Resources for ESORICS2018
Introduction
The following links are provided for anyone who wants to follow our ideas in paper "Phishing Attacks Modifications and Evolutions", all the files are in JSON format, except the SCL graph files and the DOM folder, which is organized by three types of files: 1) screentshot file(*.png), 2)URL file(*.url), 3)DOM file(*.html). URL file(*.url) includes two lines. The content in the first line is the first URL of page, and the second line is the final URL of page. The prefix of file name in DOM folder is MD5 generated by the first URL of page. To facilitate the work of dealing with data, except the links in "URLs" section, all the other links provided in this page are the list of files in corresponding DOM folder.
For the "Phishing URLs" link in "URL" section, it's organized by a nested array, as the following format.
array(
    array(
        "file name",
        "URL",
        "submission date",
    ),
)
For the "Legitimate URLs" link in "URL" section, it's organized as the following format.
array(
    array(
        "file name",
        "URL",
    ),
    ...
)
For the links in "Clustering Result" section, it's organized as the following format.
dictionary(
    "flagged":
        array(
            array(
                "tag vector"
            ),
            ...
        ),
    "unknown":
        array(
            array(
                "tag vector"
            ),
            ...
        )
)
DOMs
The DOM Folder is too large, more than 5GB, here we divide them into a few small files. The maximum size of each file is 1GB.
Phishing DOM From January 1st, 2016 to October 31th, 2017
Link1
Link2
Link3
Link4
Link5
Link6
Link7
Link8
Link9
Legitimate DOM of Sites in Alexa (original source)
Link1
Link2
Link3
Link4
Link5
Link6
Link7
Link8
Link9
Link10
Link11
Link12
Link13
Link14
Link15
Link16
Link17
Link18
Link19
Link20
Link21
Link22
Link23
Link24
Link25
Link26
Link27
Link28
Link29
Link30
Link31
Link32
Link33
URLs
Tag Corpus
Original tag corpus
Tag corpus after removing tag meta
Clustering Results
Clustering results based on our prevous research (WWW17 "Tracking Phishing Attacks Over Time")
Clustering results in this paper (after removing tag meta)
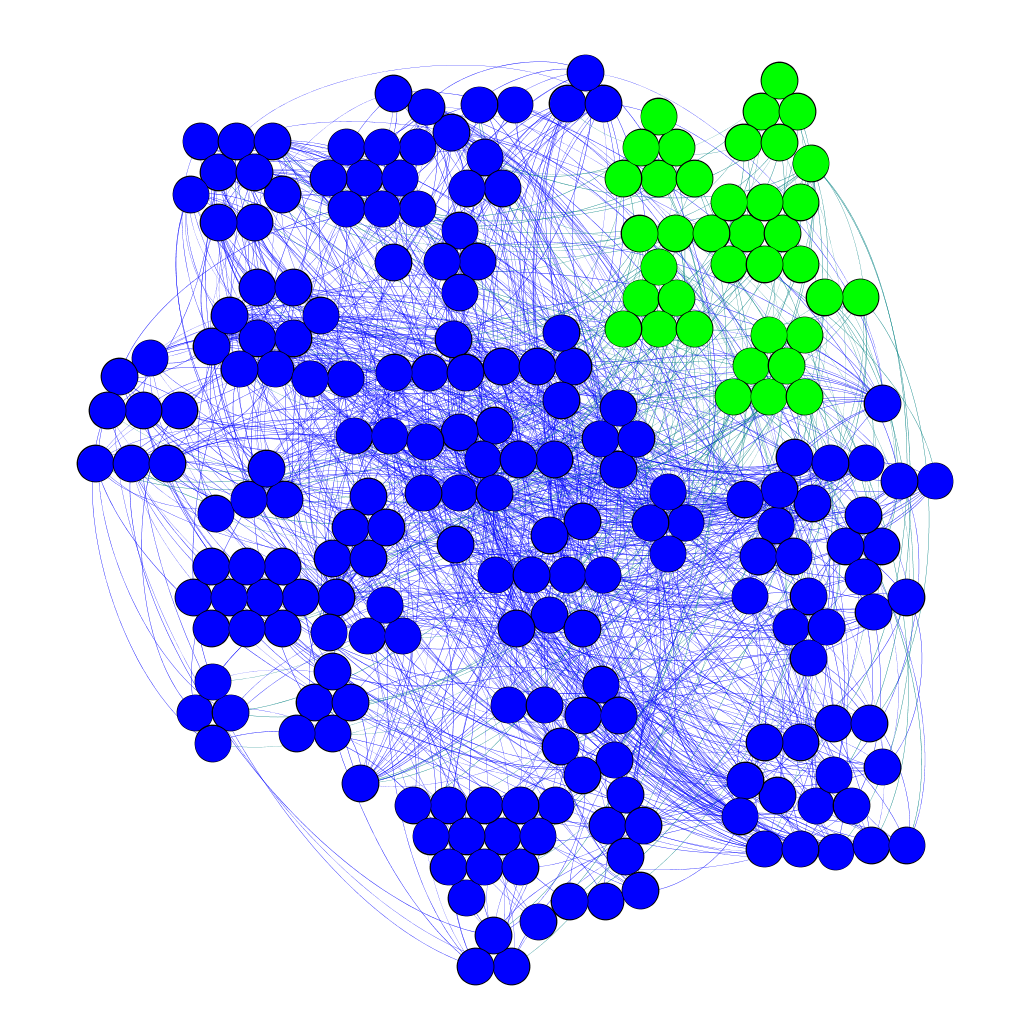
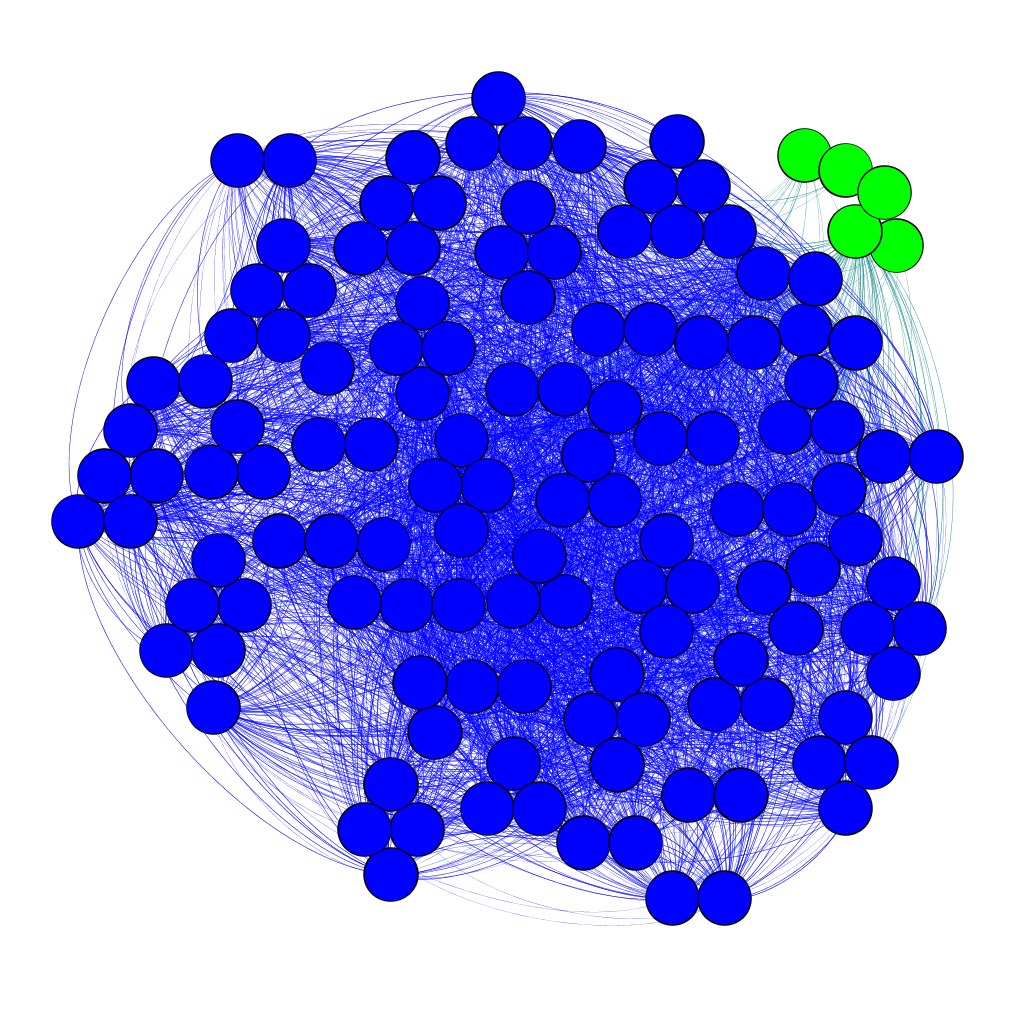
Samples of the SCL Graph (Gephi Format)
Gephi software offcial page
The SCL graphs of cluster 0 and cluster 1